Prometheus快速入门
一、背景
我们日常开发和运维中,需要监控一些数据,根据这些数据进行分析或者应对策略,例如以下几个维度:
场景
描述
硬件系统
温度,硬件故障
系统监控
CPU,内存,磁盘,网卡流量,TCP状态,进程数
应用监控
Nginx,Tomcat,PHP,MySQL,Redis 等
日志监控
系统日志,服务日志,访问日志,错误日志
安全监控
WAF,敏感文件监控
API监控
可用性,接口请求,响应时间
业务监控
例如电商网站,每分钟产生多少订单,注册多少用户,多少活跃用户,推广活动效果
流量分析
根据流量获取用户相关信息,例如用户地理位置,某页面访问状况,页面停留时间等
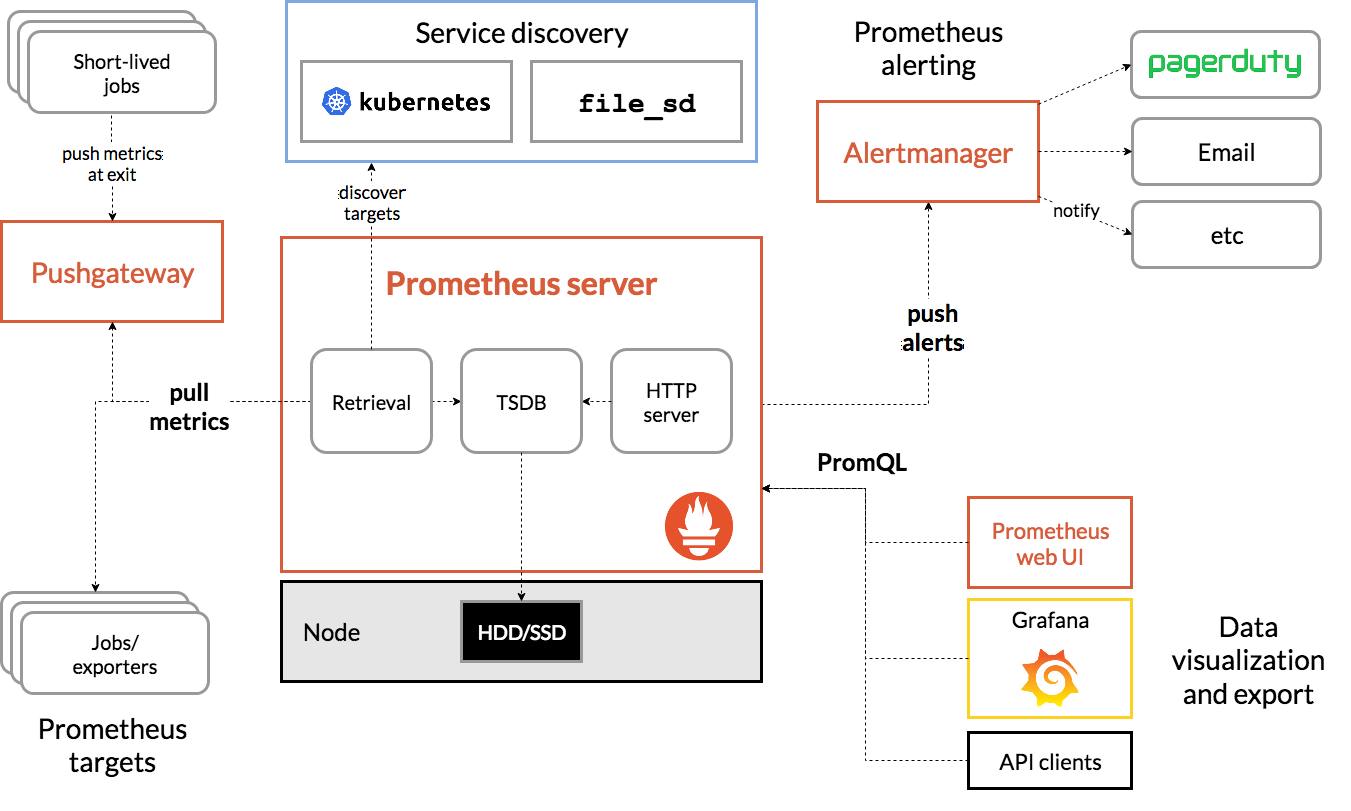
二、Prometheus是什么?
Prometheus 是由 SoundCloud 开发的开源监控报警系统和时序列数据库(TSDB)。
Prometheus由Go语言编写而成,采用Pull方式获取监控信息,并提供了多维度的数据模型和灵活的查询接口。
三、为什么需要Prometheus?
对于运维人员来说,他们需要监控机器的 CPU、内存、硬盘的使用情况,以此来保证运行在机器上的应用的稳定性。
对于研发人员来说,他们关注某个异常指标的变化情况,从而来保证业务的稳定运行。
对于产品或运营来说,他们更关心产品层面的事情,例如:某个活动参加人数的增长情况,活动积分的发放情况。
例如 :运维希望在 CPU 达到 80% 的时候给值班的运维人员发送邮件,产品希望活动积分发放数量超过 10 万的时候发送告警邮件。这些都可以通过 Prometheus 实现。
对于流量不是很大的系统来说,出现几分钟的故障可能造成不了多少损失。但是对于像淘宝、美团、字节跳动这样的巨无霸来说,宕机 1 分钟损失的金额可能就是几百万!
所以弄清楚此时此刻系统的运行是否正常?各项业务指标是否超过阈值?这些问题是每个经验丰富的研发人员所需要关注的事情!
那么如何监控你的系统?如何得知系统目前是正常还是异常?甚至如何预知未来一段时间系统可能出问题?Prometheus 正是这么一套数据监控解决方案。它能让你随时掌控系统的运行状态,快速定位出现问题的位置,快速排除故障。
只要按照 Prometheus 的方式来做,按部就班地学习和部署,我们就可以监控机器的 CPU、内存等资源的使用情况、Java 应用的运行情况以及业务各项指标的实时数据。
而通过 Prometheus 则可以直接部署使用,并且其与 Grafana 配套使用可以呈现出非常多样化的图表配置。对于中小规模的团队来说,可以极大地减少成本,加快研发速度。
而对于个人来讲,掌握 Prometheus 可以增加你当 leader 的竞争力。 毕竟如果一个研发对自己的系统运行状况都不了解,那么他怎么做 leader,怎么带领一个团队往前冲呢?
四、Prometheus Quickly Start
1、实现目标
实现一个Web服务接口请求速率状况的监控功能,当接口请求增长速率超出设定的阈值时,发送钉钉消息通知给研发运维人员。
2、服务搭建
这里使用Docker 搭建 prometheus、alertmanager和dingtalk.
① 创建对应文件目录:
1
2
3
4
mkdir -p ~/prometheus/ && cd ~/prometheus/ && touch prometheus.ymlmkdir -p ~/prometheus/groups/nodegroups/ && cd ~/prometheus/groups/nodegroups/ && touch node.jsonmkdir -p ~/prometheus/rules/ && cd ~/prometheus/rules/ && touch http-rate.rulesmkdir -p ~/prometheus/alertmanager && /prometheus/alertmanager && touch alertmanager.yml
② 配置对应文件
prometheus.yml
1
2
3
4
5
6
7
8
9
10
11
12
13
14
15
16
17
18
19
20
21
22
23
24
25
26
27
28
29
30
global: scrape_interval: 15s external_labels: monitor: 'codelab-monitor' scrape_configs: - job_name: 'prometheus' scrape_interval: 5s static_configs: - targets: ['localhost:9090' ] - job_name: 'prometheus-sample' file_sd_configs: - files: ['/usr/local/prometheus/groups/nodegroups/*.json' ] alerting: alertmanagers: - static_configs: - targets: - 192.168.220.121:9093 rule_files: - "/usr/local/prometheus/rules/*.rules"
node.json
1
2
3
4
5
6
7
8
9
[ { "targets" : ["192.168.220.121:8080" ,"192.168.220.121:8081" ], "labels" : { "instance" : "vm-192.168.220.121" , "service" : "node-service" } } ]
http-rate.rules
1
2
3
4
5
6
7
8
9
10
groups : - name: http-rate rules: - alert: http-rate expr : rate(prometheus_sample_hello_world_count[1m]) > 100 for : 15s labels: severity: 1 annotations: summary: "{{ $labels .instance }} HTTP 1min请求增长率超过100%"
alertmanager.yml
1 2 3 4 5 6 7 8 9 10 11 12 13 14 15 16 17 18 19 20 21 22 23 24 25 26 27 28 29 30 31 32 global: resolve_timeout: 5m route: group_by: [alertname] receiver: ops_notify group_wait: 30s group_interval: 60s repeat_interval: 1h routes: - receiver: ops_notify group_wait: 10s match_re: alertname: 实例存活告警|磁盘使用率告警 receivers: - name: ops_notify webhook_configs: - url: http://192.168.220.121:8060/dingtalk/webhook/send send_resolved: true 警报失效的规则。两个警报必须具有一组相同的标签。 inhibit_rules: - source_match: severity: 'critical' target_match: severity: 'warning' equal: ['alertname' , 'dev' , 'instance' ]
config.yml
1
2
3
4
5
targets: webhook: url: https://oapi.dingtalk.com/robot/send?access_token=xxx secret: SECxxx
docker 创建服务
1
2
3
4
5
6
7
8
9
10
11
12
13
docker run --name prometheus -d -p 9090:9090 \ -v ~/prometheus/prometheus.yml:/etc/prometheus/prometheus.yml \ -v ~/prometheus/groups/:/usr/local/prometheus/groups/ \ -v ~/prometheus/rules/:/usr/local/prometheus/rules/ \ prom/prometheus:latest docker run --name alertmanager -d -p 9093:9093 \ -v ~/prometheus/alertmanager/alertmanager.yml:/etc/alertmanager/alertmanager.yml \ prom/alertmanager:latest docker run --name dingtalk -d -p 8060:8060 \ -v ~/prometheus/dingtalk/config.yml:/etc/prometheus-webhook-dingtalk/config.yml \ timonwong/prometheus-webhook-dingtalk
3、客户端代码
这里使用Go语言编写的一个简易的Web服务,代码如下:
1
2
3
4
5
6
7
8
9
10
11
12
13
14
15
16
17
18
19
20
21
22
23
24
25
26
27
28
29
30
31
32
package main import ( "flag" "fmt" "github.com/prometheus/client_golang/prometheus" "github.com/prometheus/client_golang/prometheus/promhttp" "log" "net/http" ) var port = flag.Int("p" , 8080, "-port 8080" ) func main flag.Parse() prometheus.Register(httpCount) http.Handle("/metrics" , promhttp.Handler()) http.HandleFunc("/hello" , HelloWorld) log.Fatalln(http.ListenAndServe(fmt.Sprintf(":%d" , *port), nil)) } var httpCount = prometheus.NewCounter( prometheus.CounterOpts{ Name: "prometheus_sample_hello_world_count" , Help: "hello world count!" , }, ) func HelloWorld(w http.ResponseWriter, r *http.Request) { httpCount.Inc() w.Write([]byte("Hello World!" )) }
这里我们启动两个节点:
1
2
go run main -p 8080 go run main -p 8081
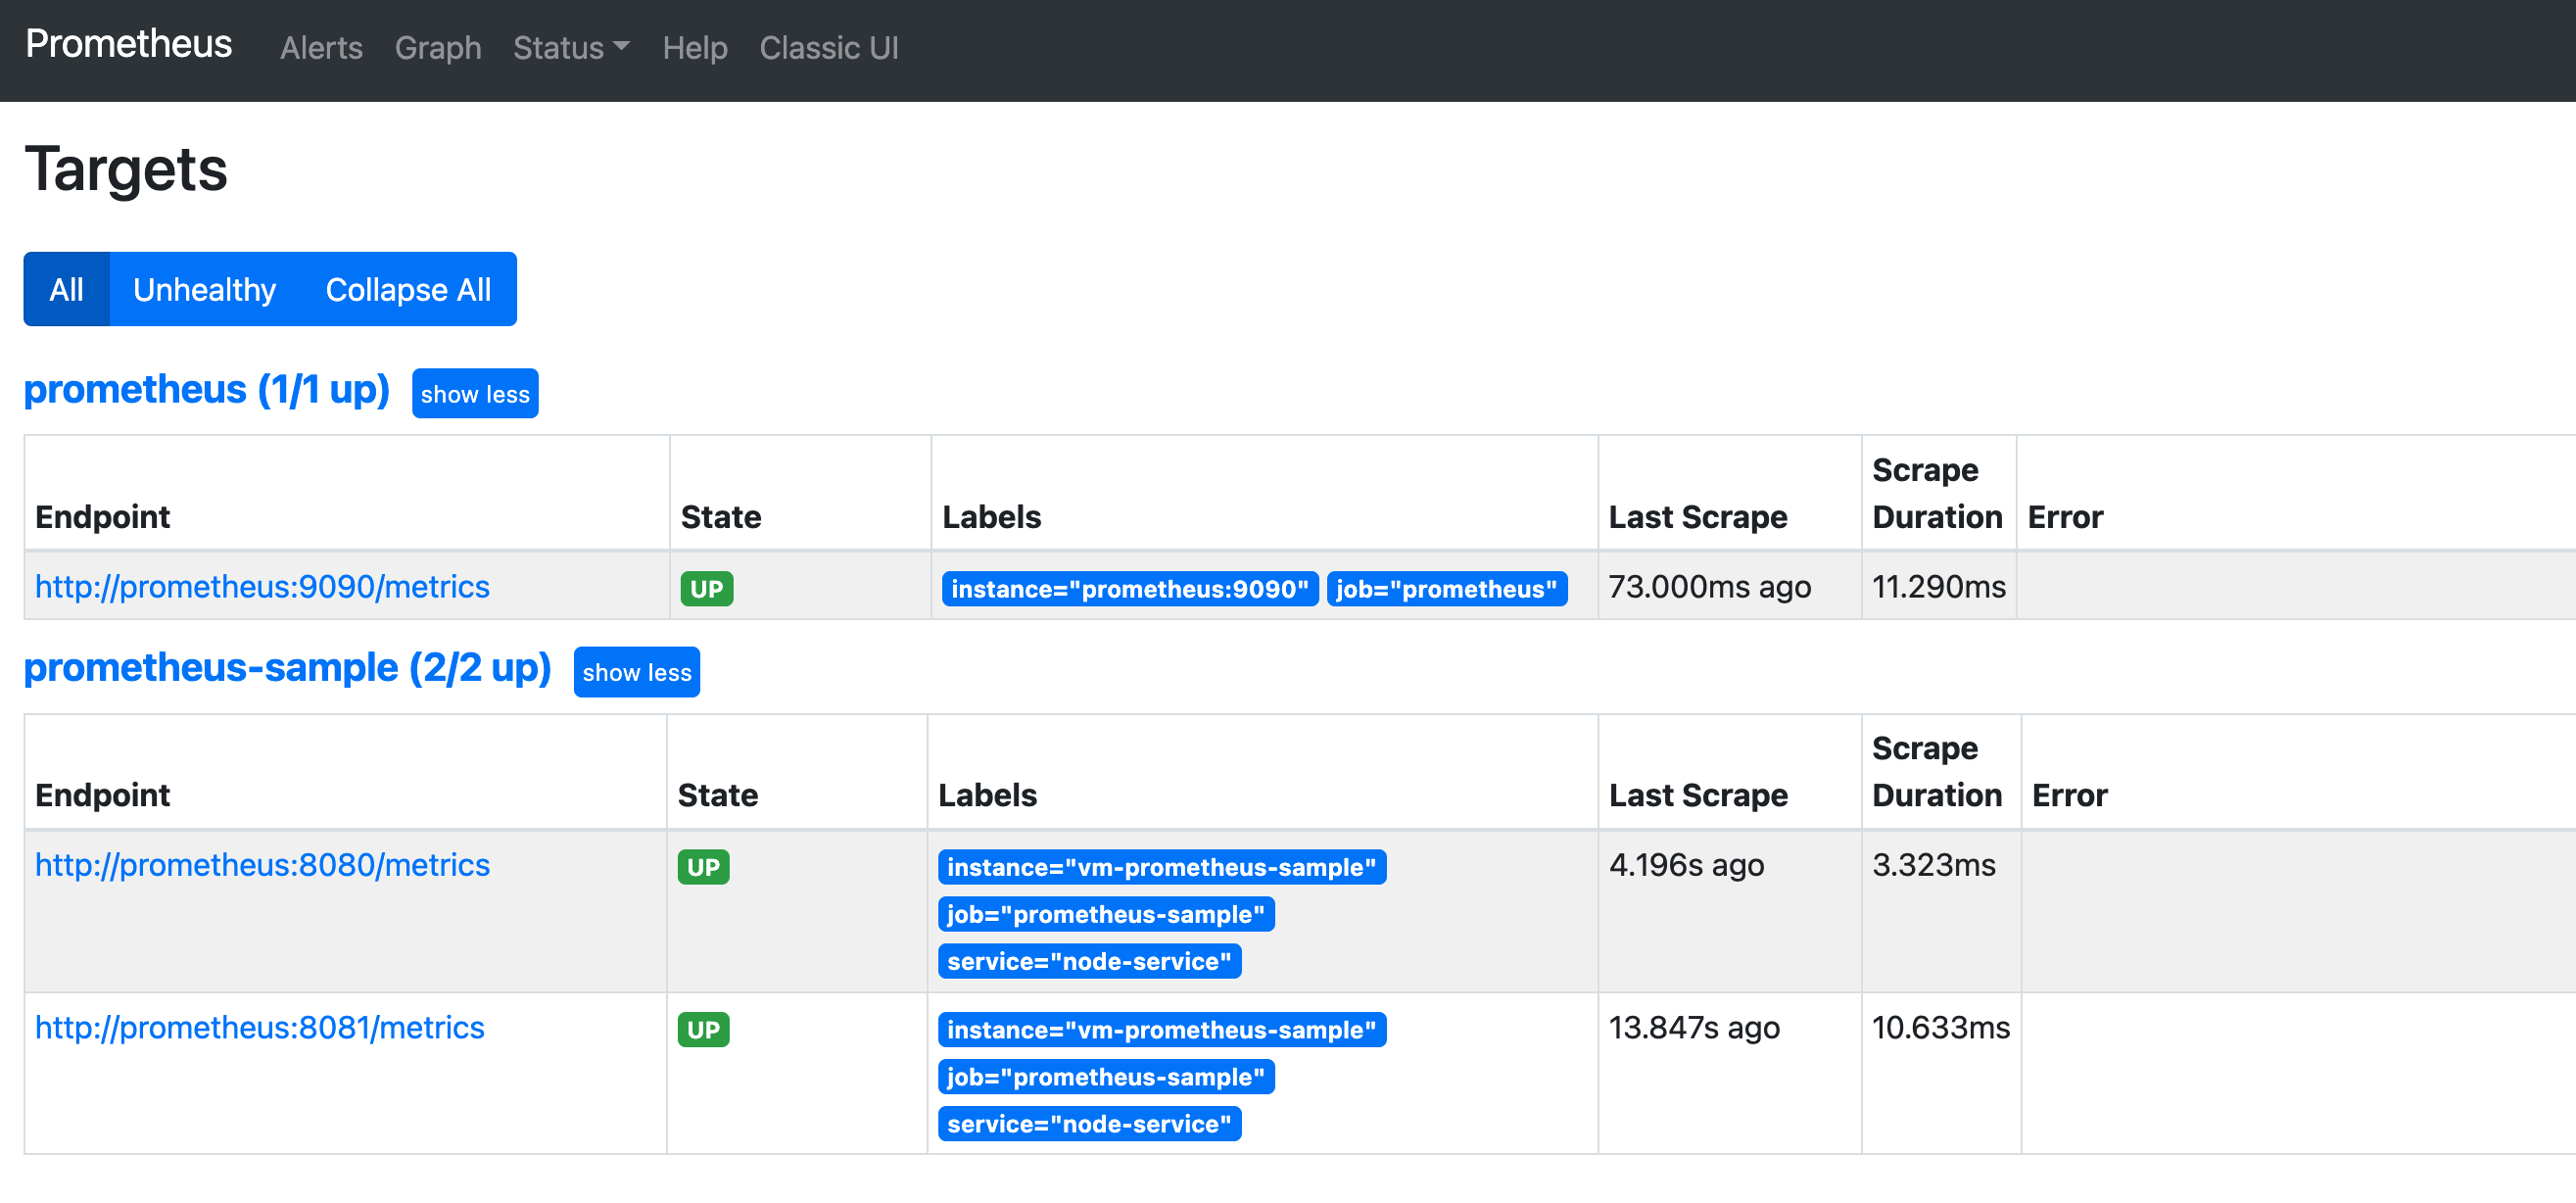
4、Prometheus Dashboard
打开仪表盘:http://localhost:9090/targets ,我们可以看到我们的两个节点已经是up状态了。
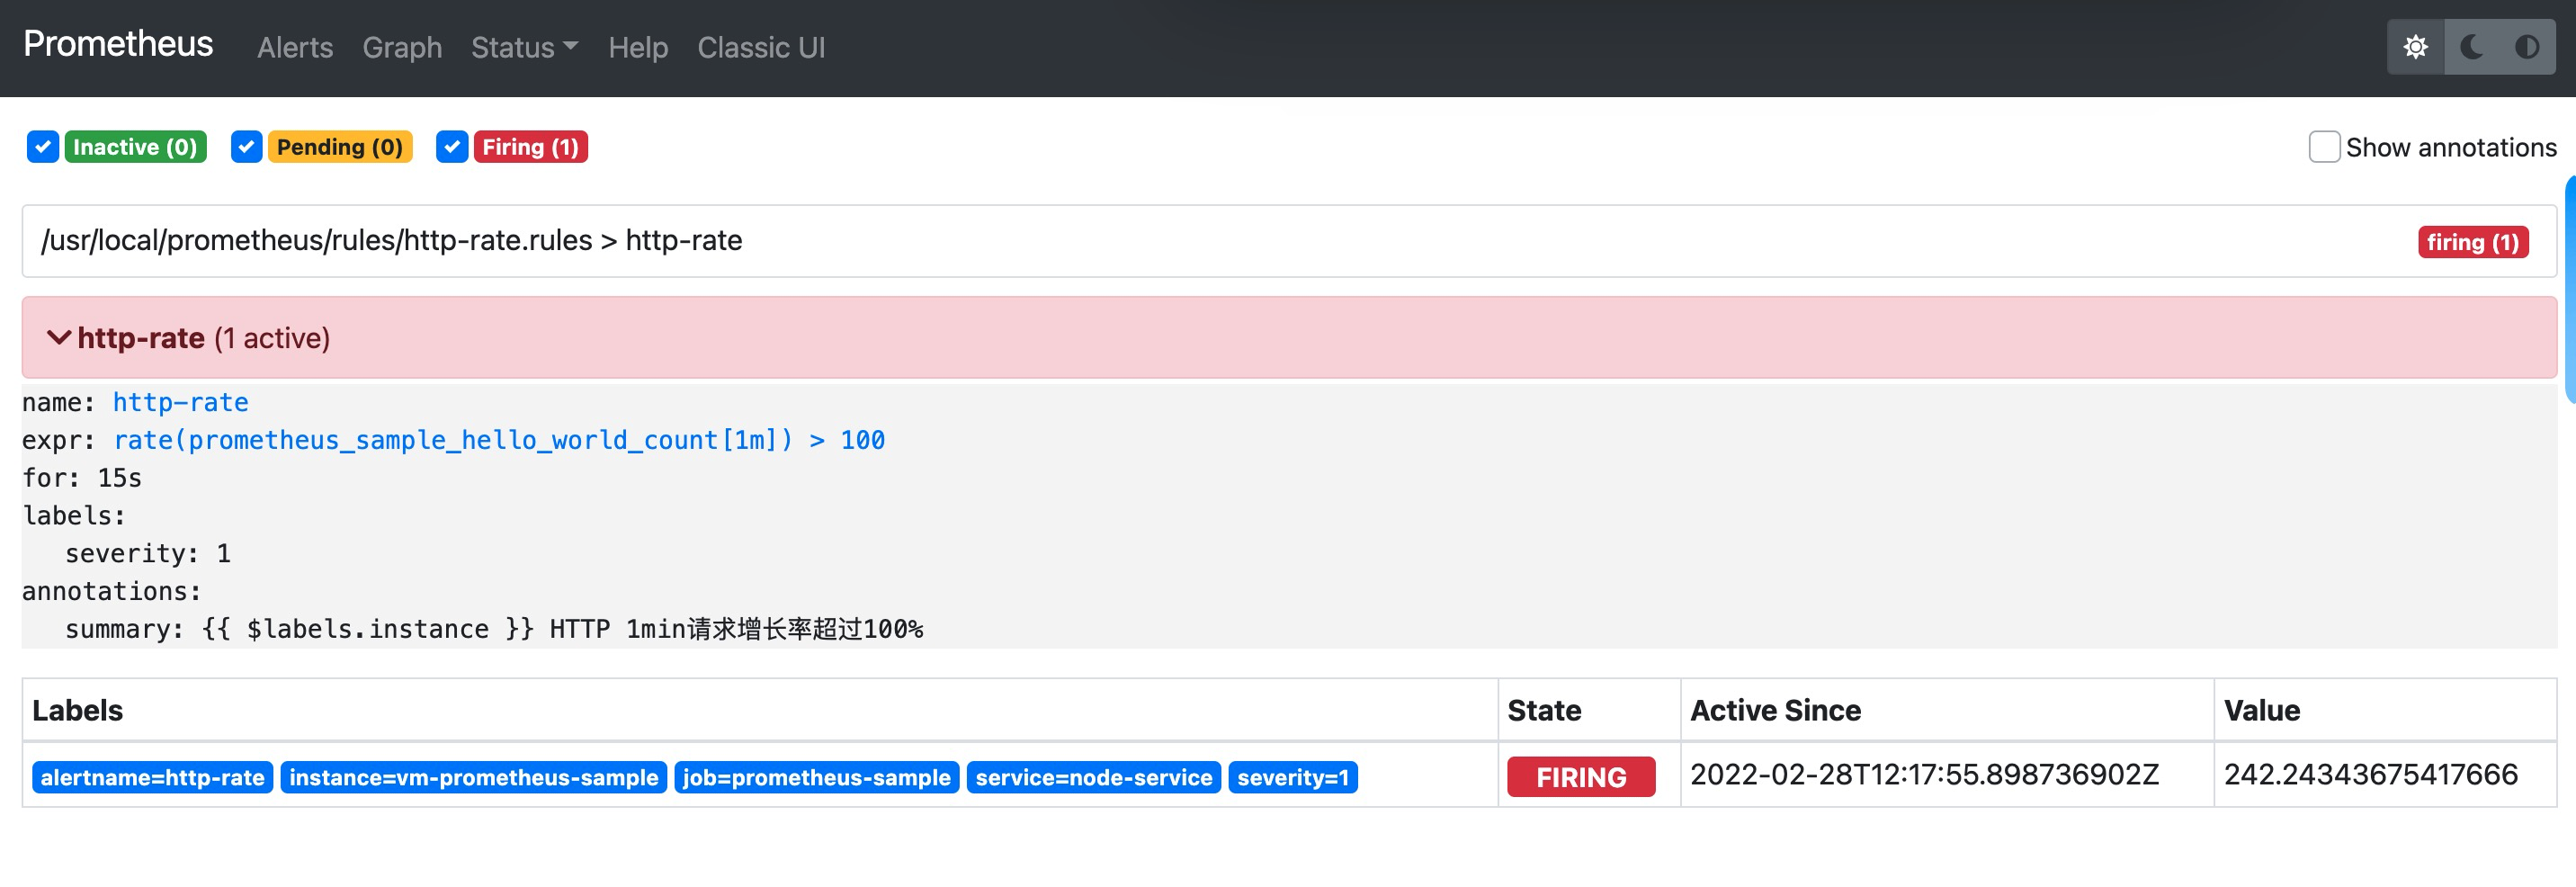
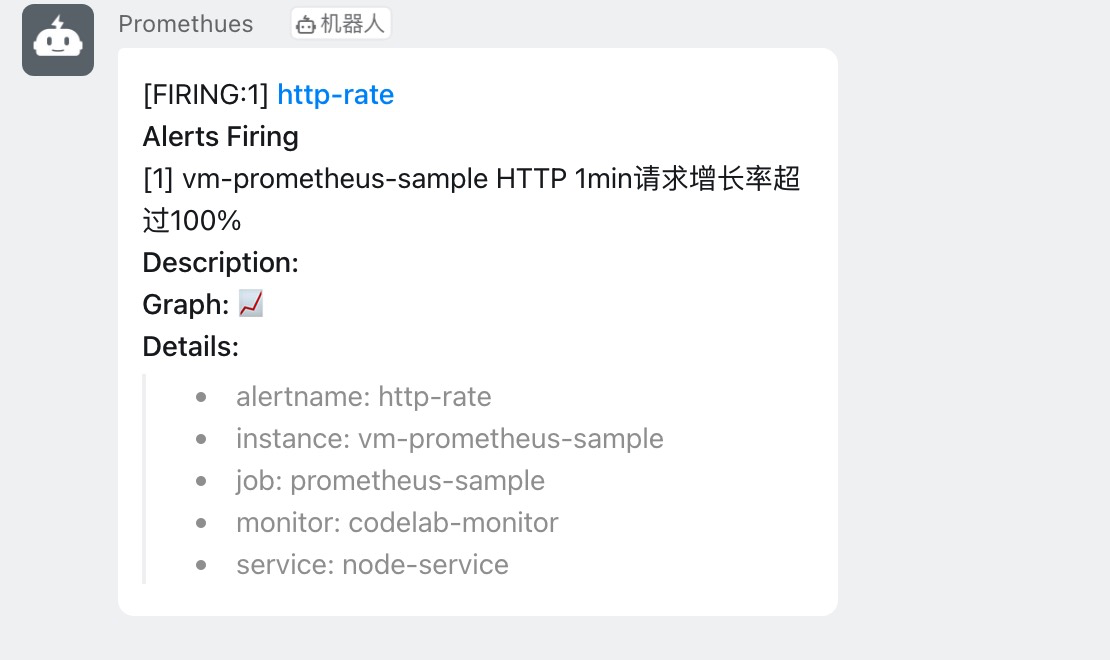
下面我们使用ab 工具模拟接口访问,使请求速度超过我们设定的阈值,此时alertmanages会给我们钉钉进行通知。
1 ab -n 1000 -c 5 http://localhost:8080/hello
我可以查看Prometheus控制台,查看消息警告发送情况,此时,我们的钉钉已经收到通知警告:
5、总结
我们通过一个简单的实验,实现了一个接口请求速率监控的例子,实际业务中我们还可以做更多服务监控的功能。也可以结合Grafana进行Dashbords数据报表展示等功能。同时可以监控服务器、JVM、k8s等等,当服务按照我们设置的规则达到阈值时通知到我们,我们可以在第一时间做应对处理,避免造成不必要的损失。